Solar investment has broken a record. When will households feel it?
New data points to a record year for investment decisions on large solar farms. That signals future generation, not an immediate fall in household bills.

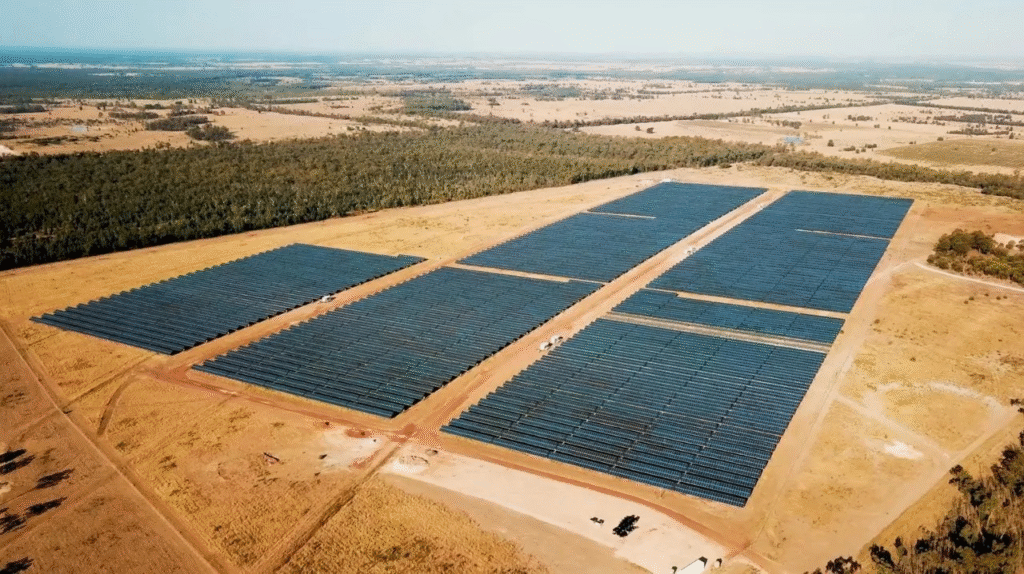
Mokoan and Winton solar farms, photographed in 2025. Illustrative image, not a project newly reaching investment decision in the reported quarter. Image reproduced from: Wikimedia Commons, Aerial view of Mokoan and Winton Solar Farms.jpg. Credit: Robert Myers. CC BY-SA 3.0 AU. Resized and cropped for display.
Australia has made more final investment decisions on large-scale solar in 2026 than in any previous full year, according to figures reported from the Clean Energy Regulator's September-quarter data release. That is encouraging for the pipeline of new generation. It does not mean all that capacity is already feeding the grid, or that every household will see a lower bill this summer.
The distinction matters. A final investment decision, usually shortened to FID, means a developer and its backers have committed to proceed financially. A solar farm still has to be built, connected, tested and operated before its output can affect the electricity market. The timing varies by project, and the cost of energy on a household bill also depends on networks, retail charges, tariffs and when that household uses electricity.
The regulator published its Q3 2026 data workbook on 15 October, ahead of the full quarterly report expected in December. pv magazine Australia's account of the workbook puts solar FIDs at about 1 gigawatt in the September quarter, following about 2 gigawatts in the June quarter. It reports a 2026 solar total of roughly 3.5 gigawatts, about 30 per cent above the previous annual solar FID record. These are project capacity measures, not electricity generated or household savings.
What the record actually counts
The same reporting says 2.1 gigawatts of large-scale renewable projects, including wind as well as solar, reached FID in the September quarter. That takes renewable FIDs in 2026 to about 5 gigawatts and past a previous full-year high of 4.9 gigawatts. Do not confuse that broader renewable figure with the solar-only total. A gigawatt describes a project's rated capacity. A gigawatt-hour measures electricity produced or stored over time. They answer different questions.
The Clean Energy Regulator explains that the September release is data without the analysis that will come with its full report. We have therefore treated the early figures as a snapshot. They can be revised, and a project's financial commitment is one milestone in a longer process. The announcement is useful evidence that developers are prepared to put money behind projects, rather than proof that all projects will meet a particular commissioning date.
For a household deciding whether to install rooftop solar, this is also a different market segment. A utility-scale project sells into the wider electricity system. Your rooftop system first changes how much electricity you buy at home and may export any unused generation under your plan's rules. It is possible for large-scale solar investment to grow while your own feed-in tariff falls, because export payments depend on local network conditions and the retail offer, not simply national project spending.
Rooftop solar is growing too, but the figures describe another step
The same September-quarter coverage reports around 90,000 rooftop installations and 894 megawatts added in the quarter. It also says capacity added during the first nine months of 2026 reached about 2.8 gigawatts. These numbers relate to installed small-scale solar, whereas the headline 3.5 gigawatts relates to large-scale projects that made investment decisions. Adding the two together as if both represented newly operating generation would mislead readers.
Australia has already seen how abundant rooftop output can shape the middle of the day. SolarAnswers has previously covered a National Electricity Market rooftop solar record and the Solar Sharer midday electricity offer. More daytime generation makes the hours of consumption important. A household can capture more value by using its own output for appliances when the sun shines, provided the relevant tariff and daily routine make that worthwhile.
This is why a solar farm investment headline cannot settle a battery purchase either. A battery changes when a household uses or exports electricity, and its value depends on the installed price, usable capacity, tariff, export rules and how often it cycles. A project FID several regions away tells you little about those inputs. If a salesperson points to this investment record as a reason to buy immediately, ask them to show a calculation using your actual bills and the proposed plan.
Why more generation may still matter to bills
The wider grid sets wholesale electricity prices in five-minute intervals. When new solar begins operating, it can add supply in daylight hours. Other generators, batteries and flexible demand respond to those prices. Retail bills, however, package wholesale costs with network charges, environmental scheme costs, retail costs and the terms of a customer's plan. Competition, network constraints and the time of day all influence how changes reach consumers. No direct dollar saving follows from this FID announcement alone.
The pace of grid connection deserves attention. Developers may have financing and panels lined up while waiting for network works, approvals or commissioning. SolarAnswers' recent look at the New England Solar transformer delivery illustrates a concrete step between building a project and sending output to the grid. National investment totals hide those local schedules.
There is a useful question for policy makers and developers: how much of the committed capacity moves into construction, then reaches commercial operation, and where? A further question is how batteries, transmission and flexible demand support generation after sunset. Looking at operating capacity and actual generation in subsequent regulator and market-operator reports will give a firmer picture than an investment announcement alone.
What to do with the news as a consumer
If you are comparing retail plans, check your current usage pattern, daily supply charge, peak and off-peak rates, solar export rate and any conditions that can change those rates. Use the same annual usage assumptions for each offer. If you already have panels, read your meter and inverter data before deciding whether a battery or a new tariff is worthwhile. If you are buying solar for the first time, ask for an estimate based on your roof, shading and daytime consumption, not on a national gigawatt figure.
The 2026 record is significant because it suggests a stronger future supply pipeline. The household test comes later: which projects are completed, whether the grid can use their output, and how retailers price electricity where you live. We will revisit the Clean Energy Regulator's figures when its full September-quarter analysis is published.
References checked 18 October 2026
- Clean Energy Regulator, Q3 2026 data workbook announcement, 15 October 2026.
- Clean Energy Regulator, Quarterly Carbon Market Reports index, September-quarter data release dated 15 October 2026.
- pv magazine Australia, Ev Foley, 16 October 2026, reporting the solar and rooftop figures from the regulator's workbook.
Written by the SolarAnswers editors
We link the reporting, government, industry or manufacturer sources behind each story below, and distinguish reported claims from our own analysis. We do not sell equipment, and no installer or brand pays to be written about. How we are paid
Sources
- Clean Energy Regulator, Q3 2026 data workbook announcement, 15 October 2026
Checked 18 October 2026
- Clean Energy Regulator, Quarterly Carbon Market Reports index
Checked 18 October 2026
- pv magazine Australia, Ev Foley, 16 October 2026, analysis of CER workbook figures
Checked 18 October 2026


Comments
If comments do not appear, reload this page or browse the community.