Rooftop solar sets a new output record across the main electricity market
Rooftop systems reached about 17.49 GW at noon on 11 October, according to industry monitoring reported the next day. It was an instantaneous output record, rather than daily generation.

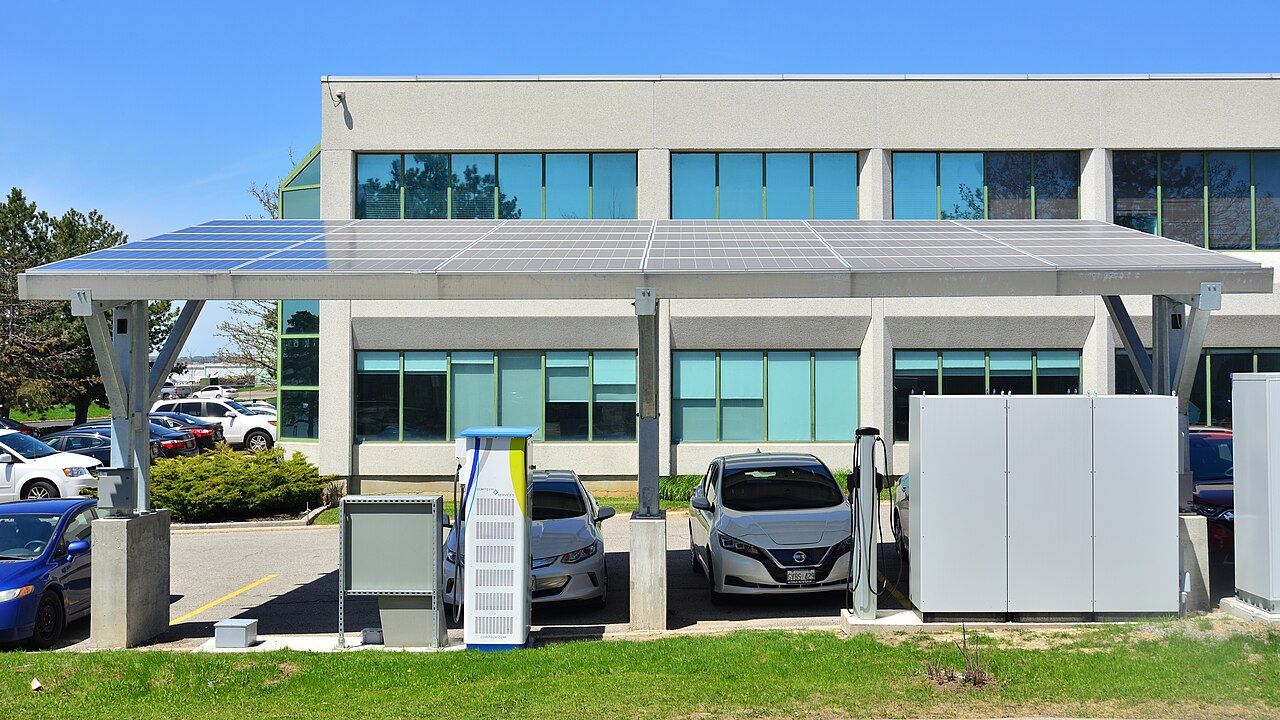
Image reproduced from: pv magazine Australia, Rooftop solar reaches new highs across NEM. Credit: Solar Victoria, as credited by pv magazine Australia.
Rooftop solar reached a new instantaneous output record across the National Electricity Market on Sunday 11 October. The milestone shows the scale of electricity now coming from household and business roofs, while also illustrating why power-system records need their units and boundaries explained.
The reported peak was 17,488 MW, or approximately 17.49 GW, at noon. It is an output measurement at a particular time, not a daily total of energy and not the installed capacity of all rooftop panels.
The national and state records
pv magazine Australia's 12 October report attributes the figures to Geoff Eldridge of Global Power Energy's NEMLog. The rooftop peak exceeded the previous 16,993 MW record by 495 MW. At the new peak, rooftop and utility-scale solar together supplied a reported 72.29% of NEM consumption.
The same report describes state rooftop records in the preceding days: 4,191 MW in Victoria and 2,070 MW in South Australia on 7 October, followed by 6,346 MW in NSW on 9 October.
These are observations for the named market and intervals. They should not be rewritten as the share of all Australian electricity supplied by solar throughout the day or year. SolarAnswers has not independently reconstructed NEMLog's estimates from the underlying data.
The difference between power and energy
Megawatts measure the rate at which electricity is being generated or used. Megawatt-hours measure the amount over time. The distinction is the same as the difference between the speed shown on a car's dashboard and the distance travelled during a trip.
For illustration, 17,488 MW sustained for one hour would represent 17,488 MWh. But the reported peak does not establish that the output stayed at that level for an hour. Daily generation requires the output across the whole day, not a multiplication of the highest observed value by daylight hours.
A percentage needs similar care. The reported 72.29% combines rooftop and large solar, and uses consumption at that time as its denominator. It does not mean rooftop systems alone provided that share.
Why a record can coexist with a disappointing household day
A market-wide total combines systems across many places. Your roof may have had clouds, shading, an outage or a different orientation while other regions were producing strongly. The national figure is not a benchmark that every individual system should have matched.
A useful household comparison starts with the same system over comparable periods. Check daily and monthly generation, any recorded faults and whether weather or shading changed. A single instantaneous peak tells you much less about the energy available to offset bills over a season.
Also distinguish the inverter's generation figure from the electricity meter's export figure. They describe different flows. A home using much of its own solar can generate well while exporting relatively little.
What the government guidance adds
The Australian Government's YourHome rooftop solar guide explains that household outcomes depend on consumption timing, location and tariffs. It also notes that network export limits may apply and that self-consumption has become especially important as feed-in payments have declined.
That helps connect the market record to practical operation. An array's output, the home's use of it and the amount permitted to leave the property can all differ. More generation is useful, but its financial value depends on where the energy goes and the terms of the electricity plan.
The same guidance discusses batteries and smart controls as ways of changing how solar is used. Whether those additions make sense requires an assessment of the household rather than the national record alone.
What to watch after the headline
The most useful follow-up indicators are generation across longer periods, daytime demand and how much energy can be used or stored when solar output is high. A new peak is one sign of the changing system; it cannot describe all of those outcomes.
For your home, keep a simple monitoring history and compare it with the assumptions in the original design. If performance changes unexpectedly, give the installer the dates, readings and fault messages. That is a clearer starting point than asking why your system did not track a national headline.
This record is significant because many small generators now contribute a large combined output. Understanding the difference between instantaneous output, total energy, self-consumption and exports makes that achievement more informative, rather than less impressive.
Written by the SolarAnswers editors
We link the reporting, government, industry or manufacturer sources behind each story below, and distinguish reported claims from our own analysis. We do not sell equipment, and no installer or brand pays to be written about. How we are paid
Sources
- pv magazine Australia, Rooftop solar reaches new highs across NEM (2026-10-12)
Checked 15 October 2026
- Australian Government, YourHome: Rooftop solar
Checked 15 October 2026


Comments
If comments do not appear, reload this page or browse the community.